
Performance monitoring and troubleshooting
Measure the speed of your bots!Automate platform is prone to various factors that may influence the performance thus resulting in bot latency. In general, it is of critical importance to monitor the processing times of bots as slower bots have disastrous effect on user experience.
All messages to bots and responses in the Automate system are measured and logged in the Analytics database.
For each bot turn the following metrics are measured:
- NLU processing time - total time spent on processing by the NLU components
- Integrations time - total time spent on execution of API calls to external REST services configured in Integrations module
- Total process time - total time spent processing by the bot that includes both NLU and Integrations time.
Platform performance can be monitored with the following SQL script
WITH
constants AS (
    SELECT
        500 AS row_limit,
        1000 AS warn_threshold,
        2000 AS crit_threshold,
        NOW() - INTERVAL '1 hour' AS one_hour_ago
),
latest_rows AS (
    SELECT
        process_time,
        nlu_time,
        integrations_time
    FROM public.message_event
    ORDER BY id DESC
    LIMIT (SELECT row_limit FROM constants)
),
avg_times AS (
    SELECT
        COALESCE(ROUND(AVG(process_time))::INT, 0) AS avg_process_time,
        COALESCE(ROUND(AVG(nlu_time))::INT, 0) AS avg_nlu_time,
        COALESCE(ROUND(AVG(integrations_time))::INT, 0) AS avg_integrations_time
    FROM latest_rows
)
SELECT
    avg_process_time AS avg_process_time_ms,
    CASE
        WHEN avg_process_time > c.crit_threshold THEN 'CRITICAL'
        WHEN avg_process_time > c.warn_threshold THEN 'WARNING'
        ELSE 'OK'
    END AS process_time_status,
    avg_nlu_time AS avg_nlu_time_ms,
    CASE
        WHEN avg_nlu_time > c.crit_threshold THEN 'CRITICAL'
        WHEN avg_nlu_time > c.warn_threshold THEN 'WARNING'
        ELSE 'OK'
    END AS nlu_time_status,
    avg_integrations_time AS avg_integrations_time_ms,
    CASE
        WHEN avg_integrations_time > c.crit_threshold THEN 'CRITICAL'
        WHEN avg_integrations_time > c.warn_threshold THEN 'WARNING'
        ELSE 'OK'
    END AS integrations_time_status
FROM avg_times
CROSS JOIN constants c;
The above script will return average processing times in the last 500 bot turns that happened within the last hour. Of course for your own needs you can modify the script.
My bot is slow - what should I do?
0. Check the nature of the delays
- Does it apply to all conversations?
- Are all bot projects slow?
- Does it happen in real conversations or in chat tester as well?
- Are slow responses correlated with specific moment in a conversation?
- If you don't have access to PostgreSQL server you can still see the timing in Conversation module (make sure SentiOne Automate is selected as Data source in
System>Platform Features>Conversations module)
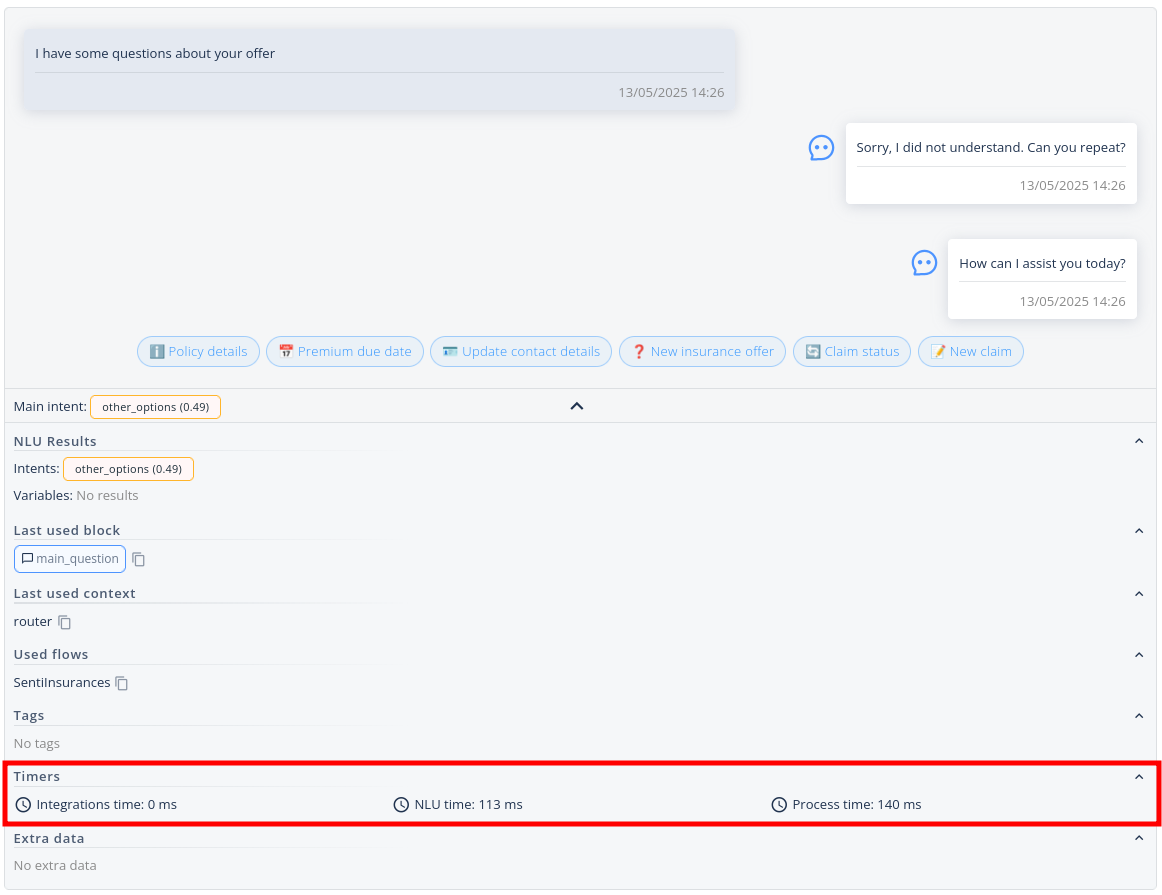
Expanded message in the Conversation module with timers
1. High NLU time
If most of the processing time is spent in NLU it may be due to several reasons:
- 💡 There are a lot of conversations and higher NLU time is expected due to higher CPU consumption.
- ➡️ Check platform scaling to verify if you infrastructure is suitable for the traffic you are experiencing
- ➡️ Check in Kubernetes which NLU nodes and pods are overloaded. Either increase number of replicas or increase CPU requests and limits.
- 💡 One of the NLU components is faulty
- ➡️ Check the logs of nlu-pipeline component. Look for StatsCollector which prints every 5 minutes detailed statistics for each NLU component. Identify which component is the slowest and verify in logs if it works correctly.
Example of StatsCollector in nlu-pipeline logs
05-19 16:15:17,309 INFO p.c.n.StatsCollector$:? - duckling service: requests count: 31, average time: 6.10 ms, max time: 14.00 ms, min time: 4.00 ms, median time: 5.00 ms, 90th percentile: 8.00 ms, 95th percentile: 10.00 ms
05-19 16:15:17,309 INFO p.c.n.StatsCollector$:? - NER service: requests count: 31, average time: 10.52 ms, max time: 172.00 ms, min time: 0.00 ms, median time: 1.00 ms, 90th percentile: 7.00 ms, 95th percentile: 45.00 ms
05-19 16:15:17,309 INFO p.c.n.StatsCollector$:? - intentizer service: requests count: 31, average time: 1.77 ms, max time: 9.00 ms, min time: 0.00 ms, median time: 1.00 ms, 90th percentile: 4.00 ms, 95th percentile: 5.00 ms
05-19 16:15:17,309 INFO p.c.n.StatsCollector$:? - keywords service: requests count: 31, average time: 2.77 ms, max time: 9.00 ms, min time: 0.00 ms, median time: 3.00 ms, 90th percentile: 5.00 ms, 95th percentile: 5.00 ms
05-19 16:15:17,309 INFO p.c.n.StatsCollector$:? - inferrer service: requests count: 31, average time: 2.90 ms, max time: 10.00 ms, min time: 1.00 ms, median time: 2.00 ms, 90th percentile: 4.00 ms, 95th percentile: 5.50 ms
05-19 16:15:17,309 INFO p.c.n.StatsCollector$:? - tokenizer service: requests count: 31, average time: 16.97 ms, max time: 24.00 ms, min time: 10.00 ms, median time: 15.00 ms, 90th percentile: 23.00 ms, 95th percentile: 24.00 ms
05-19 16:15:17,309 INFO p.c.n.StatsCollector$:? - regexp service: requests count: 31, average time: 3.58 ms, max time: 42.00 ms, min time: 1.00 ms, median time: 2.00 ms, 90th percentile: 5.00 ms, 95th percentile: 8.50 ms
05-19 16:15:17,309 INFO p.c.n.StatsCollector$:? - pattern service: requests count: 31, average time: 4.97 ms, max time: 11.00 ms, min time: 2.00 ms, median time: 4.00 ms, 90th percentile: 9.00 ms, 95th percentile: 10.00 ms05-19 16:15:17,309 INFO p.c.n.StatsCollector$:? - Stats from the last 5 minutes:
2. High Integrations time
➡️ Check the performance of Integrations that your bot is using
➡️ Contact the owners of the APIs to check the performance issues on their end
➡️ Maybe the integration is slow by design? If so, please check the Blocking Operation guide on how to handle them
3. High total processing time
There might be a situation that processing time stays high even though NLU and Integrations time is low.
- 💡 Degraded performance of PostgreSQL database
- ➡️ Verify the performance of the PostgreSQL database, especially the chatbot-dialog-manager database.
- ➡️ You can log into psql and try to run simple SQL SELECT queries to manually verify the performance
- ➡️ Verify that chatbot-dialog-manager. dialogtable is being cleaned of old sessions. The number should be close to the expected number of conversations that occurred within the last hour.
SELECT COUNT(*) FROM dialog;- ➡️ Check the status of cleaning job in database chatbots-cron-orchestrator. The job run should have status "Successful" and should be executed every hour.
SELECT * FROM public.job_runs as run LEFT JOIN public.jobs AS job ON run.job_id = job.id WHERE job."name" = 'CleanDialogManagerDb' ORDER by run.started_at DESC - 💡 Inefficient usage of system.lastConversations which performs search on analytics database
- ➡️ Analytics database may be overloaded, and it is expected that searching in past conversations with method
system.lastConversationsmay take some time.
- ➡️ Analytics database may be overloaded, and it is expected that searching in past conversations with method
4. Still no clue?
Contact us through the JIRA Service Desk Degraded performance may be a sign of something serious and there is small chance it will just fix itself ⚒️
In the report, please submit the CSV file created with following SQL executed in psql tool:
-- Calculate dynamic default date range:
-- start_date will be 30 days ago from the current date.
-- end_date will be tomorrow's date to ensure all records from today are included
-- (since the condition is message_event."time" < end_date).
-- The `quote_literal` function ensures the dates are correctly formatted as SQL string literals.
SELECT
    quote_literal((CURRENT_DATE - interval '30 days')::date) AS calculated_start_date,
    quote_literal((CURRENT_DATE + interval '1 day')::date) AS calculated_end_date
\gset

-- Set the main psql variables to these calculated default values.
-- If you need to run the script for a different, specific period,
-- you can either modify the SELECT... \gset query above,
-- or comment out the \gset and the following two \set lines,
-- and then manually set start_time and end_time, e.g.:
-- \set start_time '''2023-01-01'''
-- \set end_time '''2023-02-01'''
\set start_time :calculated_start_date
\set end_time :calculated_end_date

-- Now, the \copy command will use the :start_time and :end_time variables
-- which have been set to the last 30 days by default.
\copy (
 SELECT
  sub.godzina,
  max(sub.process_time) AS max_process_time,
  avg(sub.process_time) AS avg_process_time,
  max(sub.nlu_time) AS max_nlu_time,
  avg(sub.nlu_time) AS avg_nlu_time,
  max(sub.integrations_time) AS max_integrations_time,
  avg(sub.integrations_time) AS avg_integrations_time
 FROM (
    SELECT
        to_char("time", 'YYYY-MM-DD HH24:00') AS godzina,
        process_time,
        nlu_time,
        integrations_time
    FROM message_event
    -- Use the psql variables for the time criteria
    WHERE message_event."time" >= :start_time AND message_event."time" < :end_time
    ORDER BY time DESC
 ) AS sub
 GROUP BY sub.godzina
 ORDER BY sub.godzina DESC
)
TO 'latency.csv' WITH CSV HEADER;

-- You can optionally unset the variables if they are not needed afterwards
-- \unset calculated_start_date
-- \unset calculated_end_date
-- \unset start_time
-- \unset end_time
Updated 9 months ago