
Training analytics
The built-in function of training analytics lets us keep the overall health of intents under control. At a general level, it returns benchmark details, i.e. all the important metrics you need to know about recognition. They should be understood as direct information about the shape of the training dataset.
If you want to see the details of the recognition, you can download a .csv file where all the phrases are listed along with intents, their probability score and entities recognized in the context of each metric.
The metrics
Precision, Recall, and F1 Score are common in data science. They help get a bird’s-eye view of the training results.
To understand what they are we first need to explain true / false positives, and true / false negatives.
True positive is a correctly positive result, i.e. categorized as expected.
True negative is a correctly negative result, i.e. correctly excluded from an intent.
False positive is an incorrectly positive result, i.e. assigned to a wrong intent.
False negative is an incorrectly negative result, i.e. incorrectly excluded from an intent.

A confusion matrix
Precision
The first metric, precision, is the ratio between true positive results and all the positive results for a given intent (true or false). It shows how many phrases were assigned correctly to a given intent out of all the phrases assigned to it. The formula for precision is then as follows:
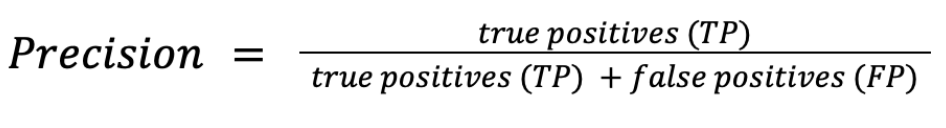
Precision equation
Recall
Another one, recall, is the ratio between true positive results and all the correct results for a given intent (correctly detected or not). It shows how many phrases were assigned correctly to a given intent out of all the phrases that were expected to be assigned to it. The formula for recall is then as follows:
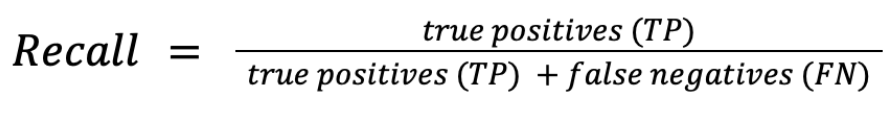
Recall equation
F1 Score
These two metrics are combined in the F1 Score which is their harmonic mean:

F1 equation
In sum, the metrics help us understand how well the predictions match our expectations and reality. Normally F1 Score is the leading quality indicator.
Updated 8 months ago