
Monitoring tools installation
Document version: 264. Automatically generated.
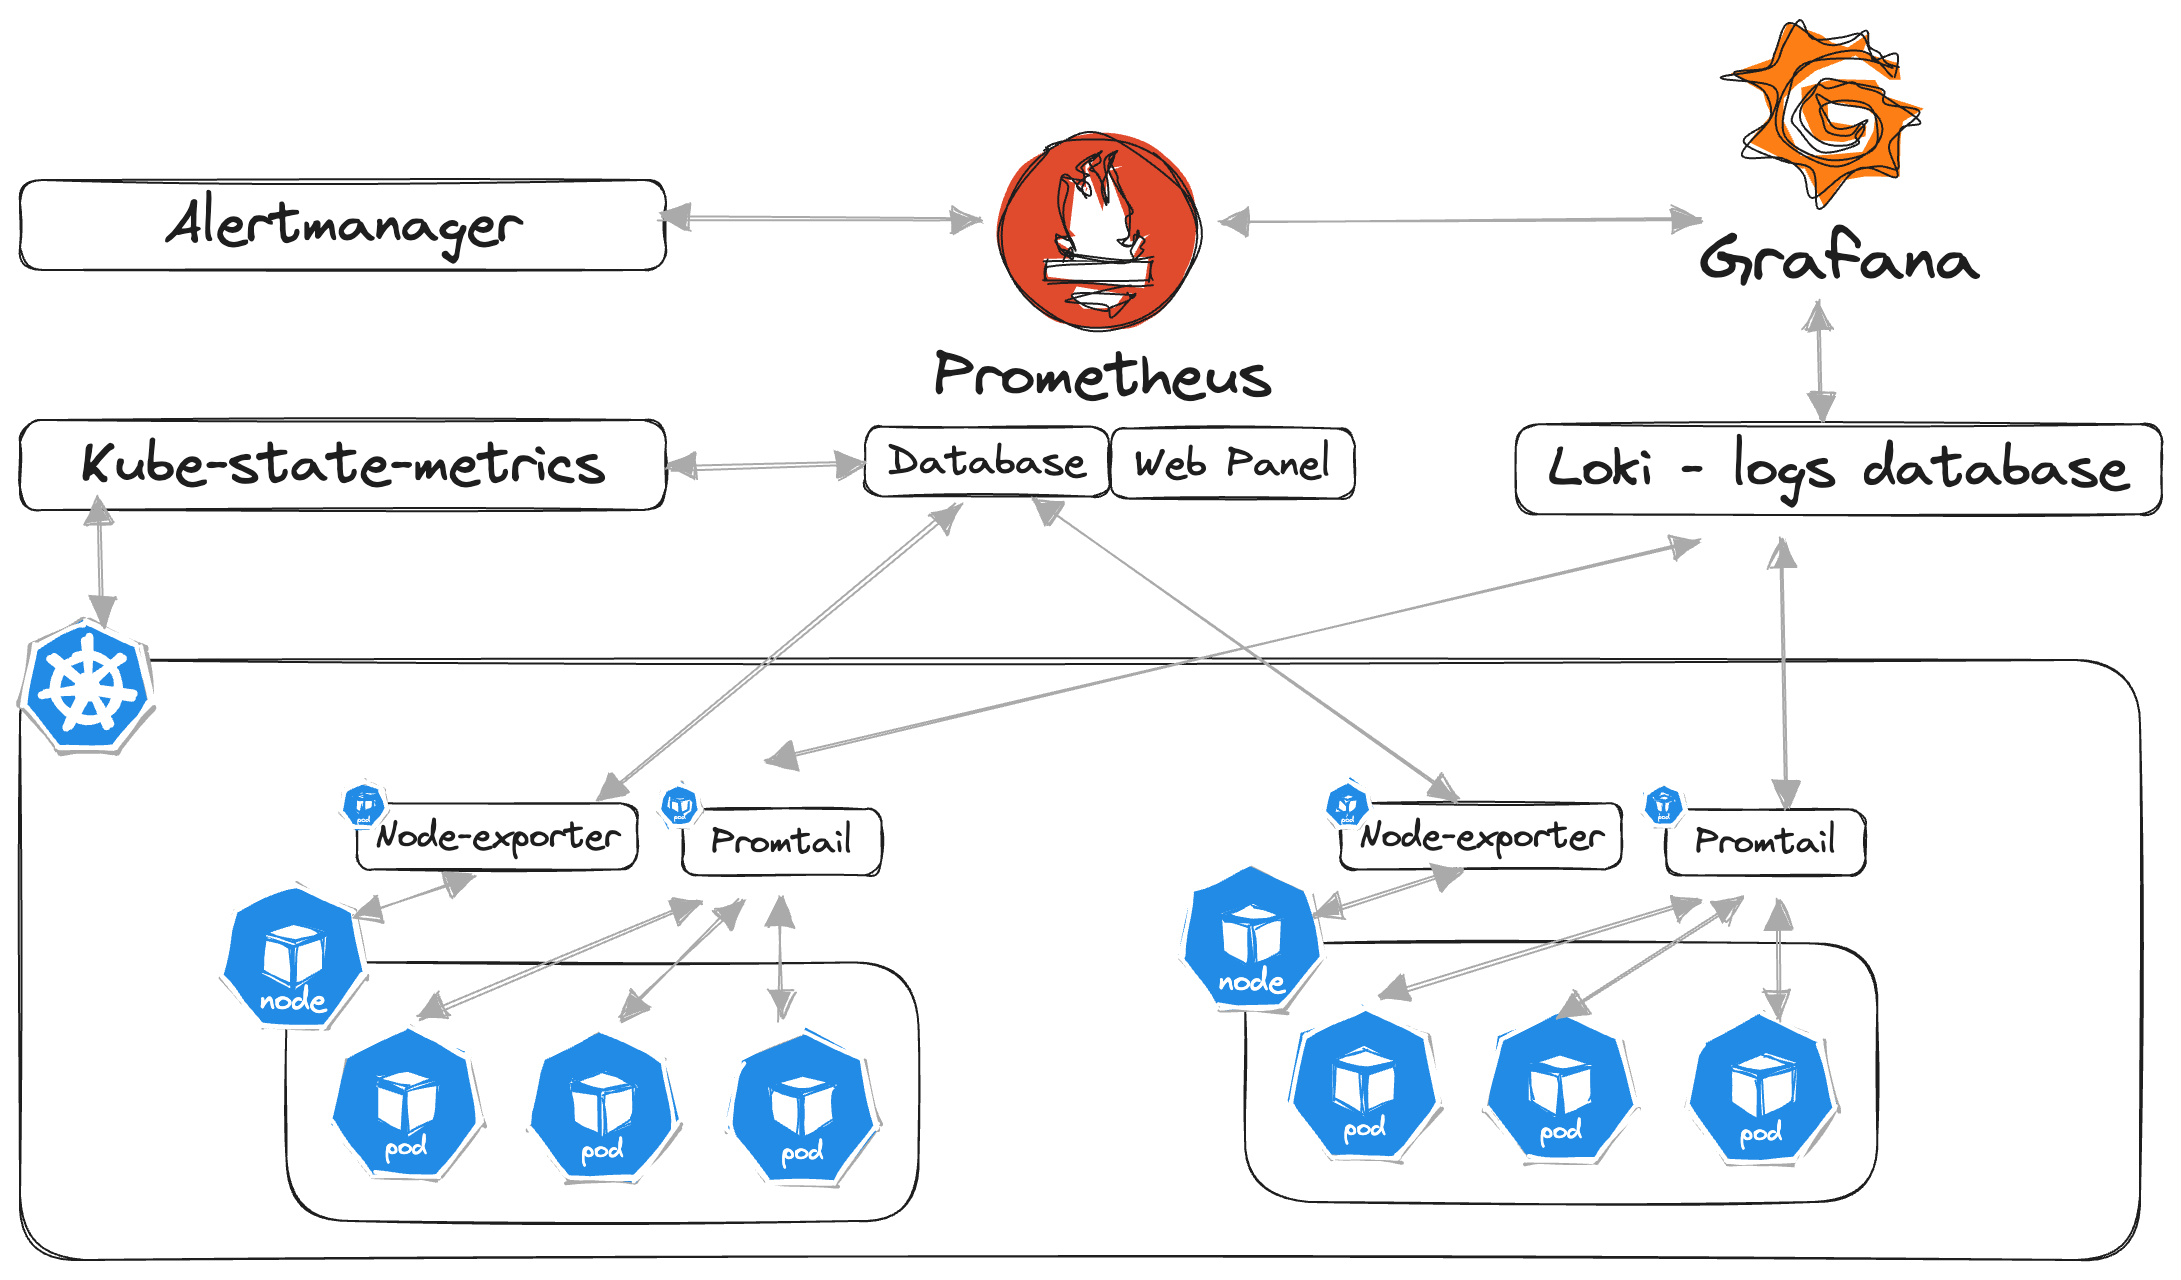
Loki is an open-source, multi-tenant log aggregation system. It can be used with Grafana and Promtrail to collect and access logs.
The Loki-based logging stack focuses on being light-weight and easy to operate.
Loki-stack helm chart has the following components:
Component Description loki log aggregation system designed to store and query logs prometheus systems monitoring and alerting toolkit grafana platform for visualizing metrics, logs, and traces alertmanager service that handles alerts sent by client applications promtail agent which ships the contents of logs to a Grafana Loki instance node-exporter prometheus exporter for hardware and OS metrics kube-state-metrics service that listens to the Kubernetes API server and generates metrics
This external service is optional and not obligatory for successful deployment of Automate platform.It's possible to install software without persistent volumes, but it means data loss whenever the component storing data will restart. Therefore for bare metal installations, we advise using Local Path Provisioner which will take care of managing local storage in each k8s node. For public cloud Kubernetes installation, there shall be available dedicated storage class options.
Prerequisites
- Kubernetes cluster
- Helm (version 3 or higher)
- Access to Automate HELM Charts repository charts.sentione.com is granted
- Access to harbor-vm-proxy.sentione.com docker images repository is granted
- Local-path-provisioner (this is optional, but highly reccomended for data persistence. It may also be replaced with other dynamic PV provisioner like OpenEBS)
Conventions
CAPITAL_LETTERS_VARIABLE_NAME- fragment which should be replaced with actual values matching particular environmentAUTOMATE_CONFIG_REPO_PATH- Path to automate configuration repository (eg./home/user/automate-config)ENVIRONMENT_NAME- Environment name (eg.production)
Steps
1. Set up helm repo
1.1 Add helm repository
helm repo add sentione-hub https://charts.sentione.com/repository/helm --username USERNAME --password PASSWORD1.2 Fetch repository data
helm repo update2. Create a dedicated namespaces
It is recommended to run SentiOne Automate platform in it's dedicated logical Kubernetes space called namespace. To create namespace please use kubectl command.
2.1 For monitoring
```shell
# creating namespace named 'monitoring'
$ kubectl create namespace monitoring
```

```shell
# verifying if namespace has been created
$ kubectl get namespaces
```
2.2 For local path provisioner
As on example below we are installing the software in dedicated local-path-storage namespace then it needs to be created in:
```sh
# creating namespace named 'local-path-storage'
$ kubectl create namespace local-path-storage
```
3. Add a docker registry secret
Kubernetes cluster pulls docker images from harbor-vm-proxy.sentione.com repository. By default, the registry is locked and needs authentication. The object type secret docker-registry is created to previously created Kubernetes namespace to authenticate.
# creating secret type object named 'sec-harbor-vm-proxy.sentione.com' - enabling access to SentiOne docker registry
$ kubectl create secret \
docker-registry sec-harbor-vm-proxy.sentione.com \
--docker-server=harbor-vm-proxy.sentione.com \
--docker-username=USERNAME \
--docker-password=PASSWORD \
[email protected] \
--namespace local-path-storage
3.1 Add a docker registry secret for kubernetes event exporter
kubectl -n local-path-storage create secret docker-registry sec-harbor-vm-proxy.sentione.com --docker-server=https://harbor-vm-proxy.sentione.com --docker-username=docker-RO --docker-password=XXX4. Local-storage installation
4.1 Run install
helm install local-path-storage --namespace local-path-storage --create-namespace sentione-hub/local-path-provisioner --version 0.0.24-dev5. Automate-monitoring installation
5.1 Values for Automate-monitoring installation
Prepare the values.yaml for setting persistent volume configuration. storageClass or storageClassName values can be adjusted when using other than loki storageClass options.
The file can be found in AUTOMATE_CONFIG_REPO_PATH/ENVIRONMENT_NAME/cluster-essentials/monitoring
grafana:
  persistence:
    enabled: true
    size: 2Gi
    storageClassName: "local-path"

loki:
  singleBinary:
    persistence:
      enabled: true
      extraVolumes: []
      extraVolumeMounts: []
      size: 5Gi
      storageClass: "local-path"

prometheus:
  server:
    persistentVolume:
      enabled: true
      size: 5Gi
      storageClass: "local-path"

  alertmanager:
    persistence:
      enabled: true
      storageClass: "local-path"
The default consumption of PV storage (after installation) could be as follows:
- grafana 2GB
- loki 5GB
- prometheus-server 5GB
- alertmanager 2GB
Please, remember it depends on kubernetes cluster size and retention setting.
5.2 Run the installation
helm -n monitoring upgrade --install -f values.yaml monitoring sentione-hub/automate-monitoring --version 1.0.66 Grafana post-configuration
6.1 Expose grafana on public URL (ingress)
Here is a sample ingress configuration for exposing grafana web service:
The file can be found as a 'grafana-ingress-example.yaml' in AUTOMATE_CONFIG_REPO_PATH/ENVIRONMENT_NAME/cluster-essentials/ingress-nginx
apiVersion: networking.k8s.io/v1
kind: Ingress
metadata:
  name: grafana.domain
  namespace: monitoring

spec:
  ingressClassName: nginx
  tls:
  - hosts:
    - grafana.domain
  rules:
  - host: grafana.domain
    http:
      paths:
      - path: /
        pathType: Prefix
        backend:
          service:
            name: monitoring-grafana
            port:
              name: service
6.2 Extract Grafana's admin login credentials
To fetch password for grafana admin user run the following command:
kubectl get secret --namespace monitoring monitoring-grafana -o jsonpath="{.data.admin-password}" | base64 --decode ; echo6.3 Grafana built-in dashboards for metrics and log browsing
Currently the are several general dashboards provided in the grafana, those could be different for different envs:
For example:
- loki - logs / app (logs from the application)
- loki - logs / k8s events (kubernetes events logs)
- loki - logs / pod (logs from the pods)
- prometheus - deployment resources usage (load of the resources during
deployments) - prometheus - kubernetes pods (resources usage for pods)
- Restarts (number of restarts for each node)
Grafana & Loki-stack monitoring can be found here
Updated 12 days ago